---
title: 'A Guide to Node.js Memory Limits and Leak Tracking'
tags:
- memory
- nodejs
- v8
- debugging
- backend
published: true
date: 2021-12-13 19:21:45
description: "A look at V8's generational garbage collection, adjusting heap memory limits, and practical ways to diagnose memory leaks."
---
## V8 Garbage Collection
The heap is where memory allocation happens, and it is divided into several `generational regions`. These `regions` are simply called `generations`, and objects share the same generation throughout their lifecycle.
There is a `young generation` and an `old generation`. The `young objects` in the `young generation` are further divided into the `nursery` and `intermediate` generations. When these objects survive garbage collection, they join the `older generation`.
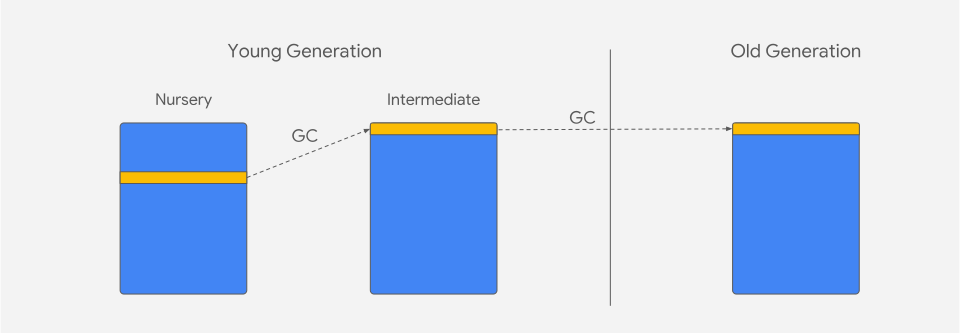
The basic premise of this generational hypothesis is that most objects die (get garbage collected) before making it to the older generation. The V8 garbage collector is designed around this fundamental assumption, and only objects that survive get promoted. As an object survives, it gets copied to the next region, and eventually ends up in the `old generation`.
There are roughly three areas where memory is consumed in Node:
- code
- call stack: primitive values such as numbers, strings, and booleans, or functions
- heap memory
Here we will focus on heap memory.
Now that we've briefly covered the garbage collector, let's allocate some memory on the heap.
```javascript
function allocateMemory(size) {
// Simulate allocation of bytes
const numbers = size / 8
const arr = []
arr.length = numbers
for (let i = 0; i < numbers; i++) {
arr[i] = i
}
return arr
}
```
Local variables live in the `young generation` and disappear as soon as the function call ends on the call stack. Primitive variables like numbers never reach the heap and are allocated on the call stack instead. The `arr` object, however, goes into the heap and can survive garbage collection.
## Is There a Limit on Heap Memory?
Now let's push a Node process to its maximum capacity and see when heap memory runs out.
```javascript
const memoryLeakAllocations = []
const field = 'heapUsed'
const allocationStep = 10000 * 1024 // 10MB
const TIME_INTERVAL_IN_MSEC = 40
setInterval(() => {
const allocation = allocateMemory(allocationStep)
memoryLeakAllocations.push(allocation)
const mu = process.memoryUsage()
// # bytes / KB / MB / GB
const gbNow = mu[field] / 1024 / 1024 / 1024
const gbRounded = Math.round(gbNow * 100) / 100
console.log(`Heap allocated ${gbRounded} GB`)
}, TIME_INTERVAL_IN_MSEC)
```
The code above keeps allocating 10 megabytes at 40ms intervals, which quickly promotes surviving objects to the `old generation` because there isn't enough time for garbage collection to keep up. `process.memoryUsage` is a tool that lets us collect metrics on current heap usage. As heap allocation grows, we track the current heap size through the `heapUsed` field.
The result varies depending on the environment. On my Mac with 16GB of memory, I got the following result:
```text
...
Heap allocated 3.95 GB
Heap allocated 3.96 GB
Heap allocated 3.97 GB
Heap allocated 3.98 GB
Heap allocated 3.99 GB
Heap allocated 4 GB
<--- Last few GCs --->
[88809:0x130008000] 23137 ms: Scavenge (reduce) 4085.6 (4094.2) -> 4085.6 (4094.2) MB, 1.6 / 0.0 ms (average mu = 0.855, current mu = 0.691) allocation failure
[88809:0x130008000] 23449 ms: Mark-sweep (reduce) 4095.4 (4104.0) -> 4095.3 (4104.0) MB, 274.1 / 0.0 ms (+ 138.5 ms in 153 steps since start of marking, biggest step 6.2 ms, walltime since start of marking -558038699 ms) (average mu = 0.740, current m
<--- JS stacktrace --->
FATAL ERROR: Reached heap limit Allocation failed - JavaScript heap out of memory
```
Here we can see the garbage collector attempting memory compaction as a last resort before throwing the `heap out of memory` exception. This process reached 4.1GB and took about 23.1 seconds.
## Increasing the Memory Limit
You can increase the size using the `--max-old-space-size` parameter.
```bash
node index.js --max-old-space-size=8000
```
The command above sets the maximum limit to 8GB. Be careful when setting this size. It's best to keep it within the physically available space in RAM. If physical memory runs out, the process starts consuming disk space through virtual memory. Setting this limit too high can damage your PC.
```text
...
Heap allocated 7.8 GB
Heap allocated 7.8 GB
Heap allocated 7.81 GB
<--- Last few GCs --->
[89239:0x148008000] 51777 ms: Mark-sweep (reduce) 7992.0 (8006.7) -> 7991.8 (8006.7) MB, 2770.5 / 0.0 ms (+ 106.4 ms in 97 steps since start of marking, biggest step 8.0 ms, walltime since start of marking -558036240 ms) (average mu = 0.302, current m[89239:0x148008000] 54751 ms: Mark-sweep (reduce) 8001.7 (8016.5) -> 8001.6 (8016.5) MB, 2968.3 / 0.0 ms (average mu = 0.171, current mu = 0.002) allocation failure scavenge might not succeed
<--- JS stacktrace --->
FATAL ERROR: Reached heap limit Allocation failed - JavaScript heap out of memory
```
In production, running out of memory can take less than a minute. This is one of the reasons why you should continuously monitor and understand memory consumption. Memory consumption can grow slowly over time, and it may take several more days before you realize there's a problem. If the process keeps crashing and out-of-memory exceptions show up in the logs, there may be a memory leak in the code.
A process may also consume more memory simply because it's working with more data. If resource usage keeps growing, you may need to split it into microservices. Splitting into microservices reduces memory pressure and allows you to scale nodes horizontally.
## How to Track Memory Leaks in Node.js
The `heapUsed` variable in the `process.memoryUsage` function is useful. One way to debug a memory leak is to put the memory metrics into another tool. However, this implementation is not sophisticated, so the analysis has to be done manually.
```javascript
const path = require('path')
const fs = require('fs')
const os = require('os')
const start = Date.now()
const LOG_FILE = path.join(__dirname, 'memory-usage.csv')
fs.writeFile(LOG_FILE, 'Time Alive (secs),Memory GB' + os.EOL, () => {}) // fire-and-forget
```
To avoid storing the heap allocation metrics in memory, we write the data to a CSV file so it's easy to work with. If you want to capture memory metrics incrementally, place the code below just above the `console.log` in the test code above.
```javascript
const elapsedTimeInSecs = (Date.now() - start) / 1000
const timeRounded = Math.round(elapsedTimeInSecs * 100) / 100
fs.appendFile(LOG_FILE, timeRounded + ',' + gbRounded + os.EOL, () => {}) // fire-and-forget
```
With this code, if heap usage grows over time, you can debug the memory leak.
### index.js
```javascript
function allocateMemory(size) {
// Simulate allocation of bytes
const numbers = size / 8
const arr = []
arr.length = numbers
for (let i = 0; i < numbers; i++) {
arr[i] = i
}
return arr
}
const path = require('path')
const fs = require('fs')
const os = require('os')
const memoryLeakAllocations = []
const field = 'heapUsed'
const allocationStep = 10000 * 1024 // 10MB
const TIME_INTERVAL_IN_MSEC = 40
setInterval(() => {
const allocation = allocateMemory(allocationStep)
memoryLeakAllocations.push(allocation)
const mu = process.memoryUsage()
// # bytes / KB / MB / GB
const gbNow = mu[field] / 1024 / 1024 / 1024
const gbRounded = Math.round(gbNow * 100) / 100
const elapsedTimeInSecs = (Date.now() - start) / 1000
const timeRounded = Math.round(elapsedTimeInSecs * 100) / 100
fs.appendFile(LOG_FILE, timeRounded + ',' + gbRounded + os.EOL, () => {})
console.log(`Heap allocated ${gbRounded} GB`)
}, TIME_INTERVAL_IN_MSEC)
```

One way to make the memory leak detection code reusable is to wrap it so it runs on its own interval, since this leak detection code doesn't need to live inside the main loop.
```javascript
setInterval(() => {
const mu = process.memoryUsage()
// # bytes / KB / MB / GB
const gbNow = mu[field] / 1024 / 1024 / 1024
const gbRounded = Math.round(gbNow * 100) / 100
const elapsedTimeInSecs = (Date.now() - start) / 1000
const timeRounded = Math.round(elapsedTimeInSecs * 100) / 100
fs.appendFile(LOG_FILE, timeRounded + ',' + gbRounded + os.EOL, () => {}) // fire-and-forget
}, TIME_INTERVAL_IN_MSEC)
```
This isn't code you can use in production, but at least it demonstrates how to debug a memory leak locally. A real implementation would need safeguards against the server running out of disk space, visualization, alerting, log rotation, and so on.
## Analyzing Heap Snapshots with Chrome DevTools
With the `--inspect` flag, you can analyze heap snapshots directly in Chrome DevTools. This is the most powerful way to track down memory leaks.
```bash
node --inspect index.js
```
Then open `chrome://inspect` in Chrome and connect to the Node.js process. In the **Memory** tab, take a heap snapshot, take a second snapshot after some time has passed, and compare them to see which objects are accumulating without being released.
## Detailed Heap Information with `v8.getHeapStatistics()`
If you need more detailed V8 heap information than `process.memoryUsage()` provides, you can use the `v8` module.
```javascript
const v8 = require('v8')
const heapStats = v8.getHeapStatistics()
console.log({
total_heap_size: `${(heapStats.total_heap_size / 1024 / 1024).toFixed(2)} MB`,
used_heap_size: `${(heapStats.used_heap_size / 1024 / 1024).toFixed(2)} MB`,
heap_size_limit: `${(heapStats.heap_size_limit / 1024 / 1024).toFixed(2)} MB`,
malloced_memory: `${(heapStats.malloced_memory / 1024 / 1024).toFixed(2)} MB`,
external_memory: `${(heapStats.external_memory / 1024 / 1024).toFixed(2)} MB`,
})
```
Checking `heap_size_limit` tells you the maximum heap size of the current process. Note that the default heap size in Node.js depends on the version and system memory. Since Node.js 12, it is determined dynamically based on available system memory, typically landing somewhere between 1.5GB and 4GB.
## Tracking Memory Leaks in Production Code
Using the code above as-is in production would be a stretch. In production, you can use [a daemon process like PM2](https://pm2.keymetrics.io/docs/usage/restart-strategies/) to automatically restart the process when it exceeds a memory threshold.
```bash
pm2 start index.js --max-memory-restart 8G
```
Node.js's built-in [Diagnostic Report](https://nodejs.org/api/report.html) is also useful. It outputs the process state, heap information, native stack, and more as a JSON report.
```bash
# Automatically generate a report on OOM
node --report-on-fatalerror index.js
# Trigger manually via signal
node --report-on-signal index.js
# In another terminal: kill -USR2
```
The report includes a `javascriptHeap` section, allowing you to analyze the heap state at the moment of the OOM after the fact.
## Summary
- V8 uses generational garbage collection, and most objects are collected in the young generation.
- The default heap size is determined dynamically based on system memory and can be adjusted with `--max-old-space-size`.
- For debugging memory leaks, Chrome DevTools heap snapshots via `--inspect` are the most effective.
- In production, combine PM2 auto-restarts, Diagnostic Report, and APM tools for monitoring.